 |
ACTS
Experiment-independent tracking
|
|
ACTS
Experiment-independent tracking
|
Extracting efficiency/resolution numbers from a Sequencer run, and plotting them.
ACTS has two output options for the same performance evaluation. Each pair uses the same collector and produces the same main histogram families. The Python writer returns histograms through .histograms() after s.run(); the ROOT writer saves them in a ROOT file. ROOT output also includes some summary objects and can include matching details.
The Python writers are available from PyPI or a source build. The ROOT writers require a ROOT-enabled source build.
The pattern-recognition pair takes the same input collections and uses similar configurations. With a Sequencer and truth matcher already configured, add the Python writer like this:
The PyPI demo test executes this example. After s.run(), retrieve the results with histograms = perfWriterFinder.histograms().
For ROOT output, use acts.examples.root.RootPatternRecognitionPerformanceWriter, set the same input collection fields on its Config, and set filePath. See the PyPI finding and fitting demo for the Python writers and the truth-tracking Kalman example for ROOT output.
The track-parameter writers fit residual and pull distributions to extract mean and width profiles. The ROOT writer uses the ROOT fit backend. For the Python writer, set cfg.fitFunction = acts.examples.scipy.makeScipyHistogramFitFunction() to use SciPy instead; install scipy and numpy separately. The ROOT track-parameter writer also supports evaluation at individual track states and against calibrated measurements. The Python writer currently evaluates track reference parameters against truth particles.
TrackTruthMatcher(doubleMatching=True) is the standard way to produce the inputTrackParticleMatching/inputParticleTrackMatching collections these writers need.
The writers return efficiency, fake and duplicate track, track-summary, residual, and pull histograms according to their configuration. Names and dimensions can vary. To see the available histograms after s.run():
One-dimensional Histogram1, ProfileHistogram1, and Efficiency1 objects support .plot() with matplotlib and mplhep:
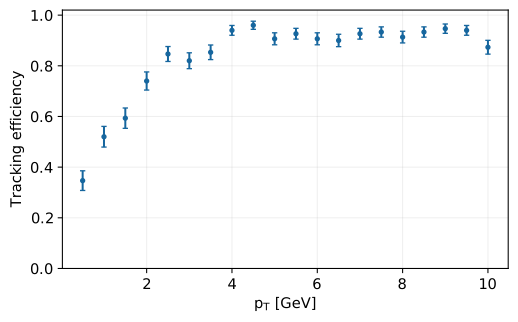
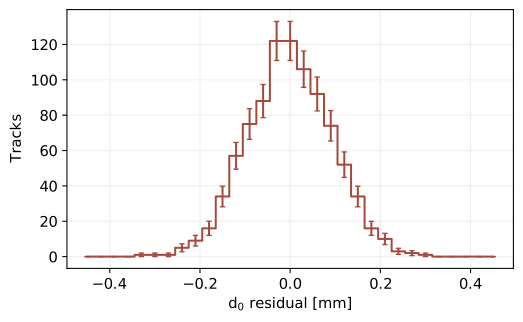
The following plots illustrate the efficiency and residual views. They use randomly sampled example counts, not measured ACTS output. The efficiency bars show binomial standard errors; the residual-count bars show square-root count uncertainties. Regenerate them with docs/examples/generate_python_performance_plots.py.
ACTS Histogram1 and ProfileHistogram1 objects can also be converted to boost-histogram objects for rebinning or other plotting tools. The converted histogram can also be serialized with Python's pickle, so you can save it and load it in a later analysis. For example, after the pattern-recognition writer has run:
For an Efficiency1, convert its .accepted and .total histograms separately.
For geometry and track visualization (not histogram plotting), see acts.examples.visualization.PyVisualization2D and TrackVisualizerAlg, and Examples/Scripts/generic_plotter.py for the YAML-configured plotting tool used by physmon.
 1.15.0